Water tests in geotechnics
Water tests make it possible to quantitatively characterize groundwater flow. They are essential for sizing dewatering, drainage, the watertightness of dams and excavations. Three main families of tests are used in practice.
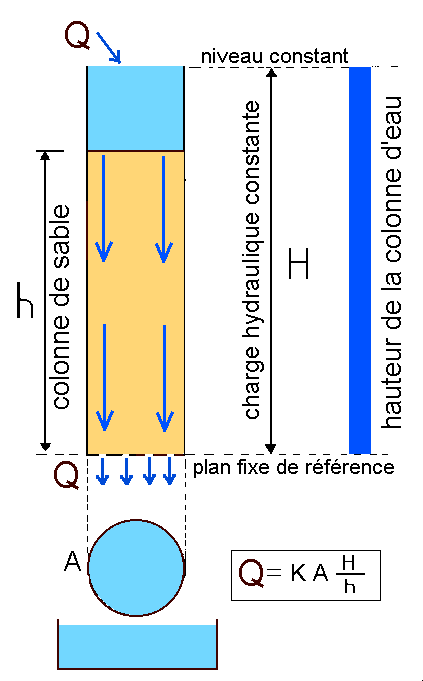
All these tests rely on the same Darcy's law, which states that the water flow rate Q through a porous medium is proportional to the permeability K, the cross-section A and the hydraulic gradient H/h.
The Lefranc test
The Lefranc test is the most widely used in everyday geotechnics. It targets highly permeable ground (permeability of the order of 10⁻³ to 10⁻⁵ m/s). It is classically used to measure the interstitial permeability of loose rocks (sands, gravels, alluvium).
Principle
The test consists of injecting water into permeable layers and measuring the volume of water absorbed under a given hydraulic head. Knowing the injected volume, the borehole diameter and the applied head, the coefficient of permeability is calculated:
Q = m · K · H · D hence K = Q / (m · H · D)
- K: coefficient of permeability (m/s)
- D: diameter of the borehole / chamber (m)
- L: height of the chamber (m)
- H: hydraulic head (m of water)
- m: shape coefficient of the chamber, m = (2π·L/D) / ln(2L/D)
The Lugeon test
The Lugeon test is rather reserved for ground of medium to low permeability (10⁻⁵ to 10⁻⁸ m/s). It is used to measure the permeability of fractures in compact rock — it is the reference test for studies of dams, grout curtains and retaining structures in rocky ground.
Principle
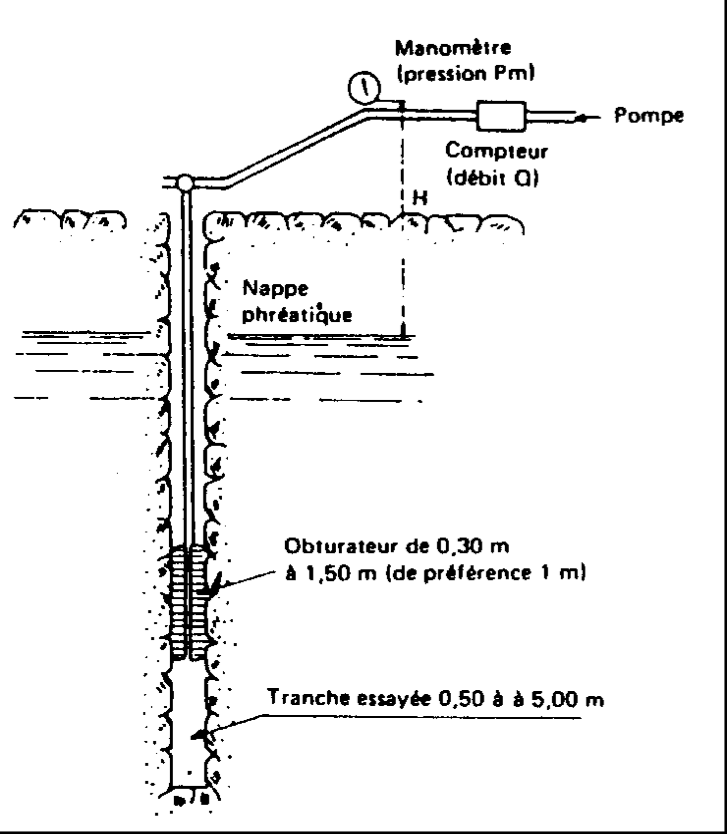
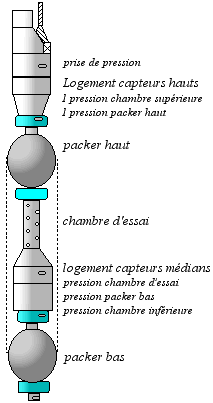
It consists of injecting water into a borehole at different pressure stages, for a constant time, in order to deduce the permeability of the geological formation. The classic stages are 1, 2, 5, 10 then 5, 2, 1 bar (ascending-descending cycle), each held for 10 minutes. The measured parameters (injected volume, applied pressure) are converted into “unit absorption” expressed in Lugeon units.
1 Lugeon = a flow rate of 1 litre/minute injected into a borehole section of 1.00 m, under a pressure of 1 MPa (10 bar), held constant for 10 minutes.
Approximate equivalence: 1 LU ≈ K = 10⁻⁷ m/s.
Analysis of the pressure-flow curve over the ascending and descending stages identifies the behaviour: laminar, turbulent, swelling, washout, clogging. If the curve is linear, one can apply:
K = (1/π) · Q · ln(R/r) / (L · H)
- Q: flow rate (m³/s)
- R: radius of influence (~ 200 m)
- r: borehole radius (m)
- L: height of the chamber (m)
- H: hydraulic head (m of water)
The pumping test
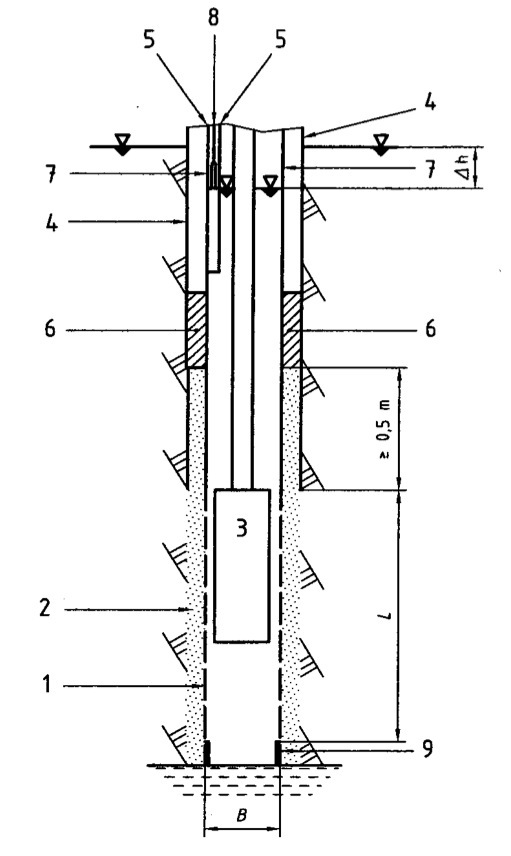
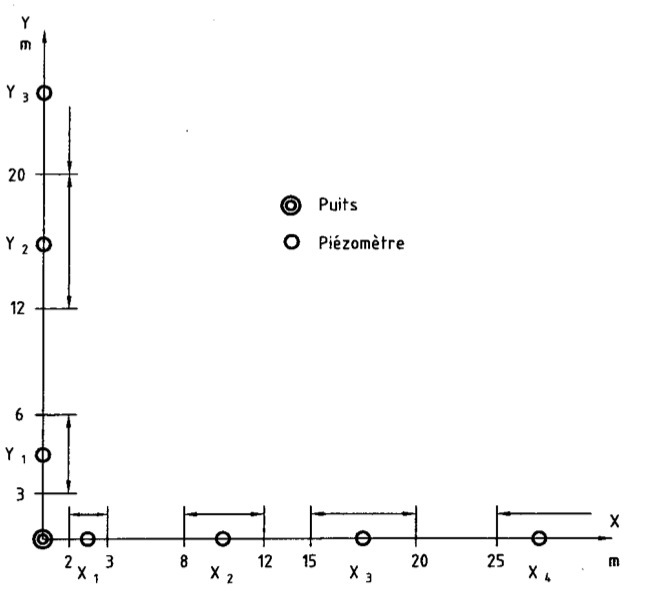
The pumping test is the most representative for characterizing an aquifer on a large scale. The principle: pump water from a central well at a constant rate, and observe the drawdown in the well and in several surrounding observation piezometers.
The parameters deduced:
- Transmissivity T (m²/s) — the aquifer's ability to transmit water; the product of K and the saturated thickness
- Storage coefficient S (dimensionless) — volume of water released per unit area and per unit drop in head
- Radius of influence of the pumping
The classic analysis methods are those of Theis (transient regime) and Jacob (logarithmic approximation in quasi-steady regime).
The flowmeter
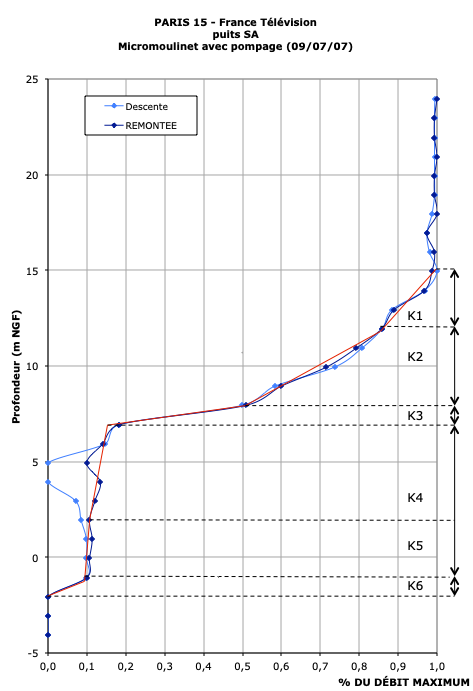
The flowmeter is a device lowered into a borehole to measure the vertical velocity of the fluid at different depths. It identifies:
- the productive water inflows within a multi-layer borehole
- the parasitic flows between superimposed aquifers (involuntary drainage)
- the most permeable zones of a fractured aquifer
The relation T = K · H makes it possible to compute the transmissivity of each identified water inflow.